
|
This technical note was validated against specific versions of hardware and software. What is described here may not work with other versions.
|
|
| Version
|
Date
|
Notes
|
| 1.0.0
|
June 2020
|
First public release
|
This Technical Note (TN) shows how to integrate Visual Studio Code (VSC) and Lauterbach PowerView TRACE32 (PVT32). The integration aims to:
- Debug the program in VSC by using PVT32 as a communication bridge with the target
- Jump from PVT32 to VSC (in editing mode) to edit the source file where an issue/bug was found.
To test the procedure, the same testbed described here was used. Therefore, the application used to validate the procedure is freertos_hello_world.
With regard to VSC, the following version was used:
Version: 1.41.1 (system setup)
Commit: 26076a4de974ead31f97692a0d32f90d735645c0
Date: 2019-12-18T14:58:56.166Z
Electron: 6.1.5
Chrome: 76.0.3809.146
Node.js: 12.4.0
V8: 7.6.303.31-electron.0
OS: Windows_NT x64 6.1.7601
Debugging in VSC by using PVT32 as a communication bridge[edit | edit source]
- After opening VSC from the root directory of the
freertos_hello_world project, install the Native Debug extension.
- Then, create a
launch.json file by selecting Debug->Add Configuration->GDB. The file should look like this:
{
    // Use IntelliSense to learn about possible attributes.
    // Hover to view descriptions of existing attributes.
    // For more information, visit: https://go.microsoft.com/fwlink/?linkid=830387
    "version": "0.2.0",
    "configurations": [
        {
            "name": "Debug (PowerView TRACE32)",
            "type": "gdb",
            "request": "launch",
            "target": "${workspaceRoot}/Debug/freertos_hello_world.elf",
            "gdbpath": "e:/Xilinx/SDK/2019.1/gnu/aarch32/nt/gcc-arm-none-eabi/bin/arm-none-eabi-gdb.exe",
            "cwd": "${workspaceRoot}",
            "valuesFormatting": "parseText",
            "autorun": [
                "target remote localhost:30000",
                "symbol-file ${workspaceRoot}/Debug/freertos_hello_world.elf",
            ]
        }
    ]
}
- Edit the PVT32's configuration file (usually named
config.t32) and add the following lines:
; Remote Control Access
GDB=NETASSIST
PORT=30000
PROTOCOL=TCP
- Run PVT32 and start a debugging session (see for instance this section).
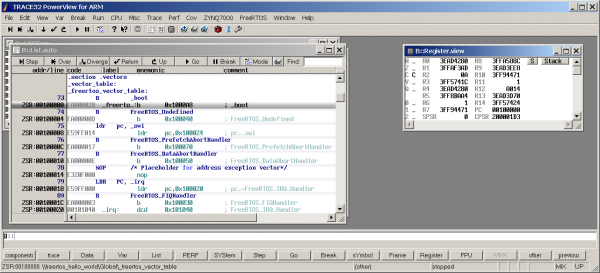
Debugging session started on PVT32 side
- On VSC side, start a debugging session by pressing F5. VSC will start a debug session that is synchronized with PVT32 as shown in the following image. So you can set breakpoints, steb-by-step execute the code, etc. on VSC side, but the actual operations will be done on the target by PVT32.
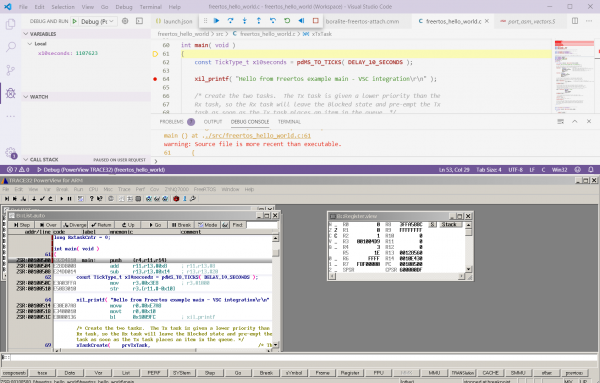
Visual Studio Code and PowerView TRACE32 synchornization during a debugging session
Jumping from PVT32 to VSC to edit source files[edit | edit source]
To enable this functionality, add the following lines to the PRACTICE script used to initialize the debugging session:
&VSCODE="E:\program_files\MicrosoftVSCode\Code.exe"
setup.editext on "&VSCODE -g ""*:#"""
While debugging, right-click on the line you want to edit and select Edit Source.
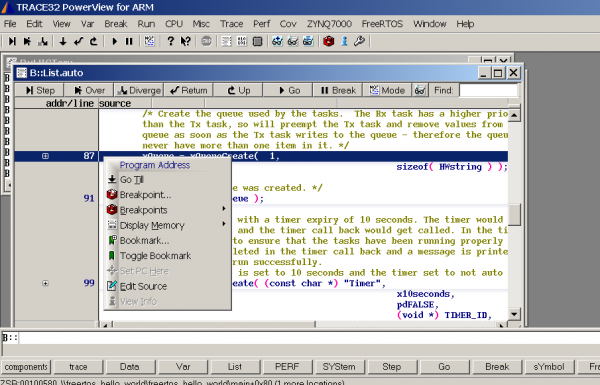
Using VSC as the default editor for PVT32
The source file will be open in VSC, which will jump on the selected line.
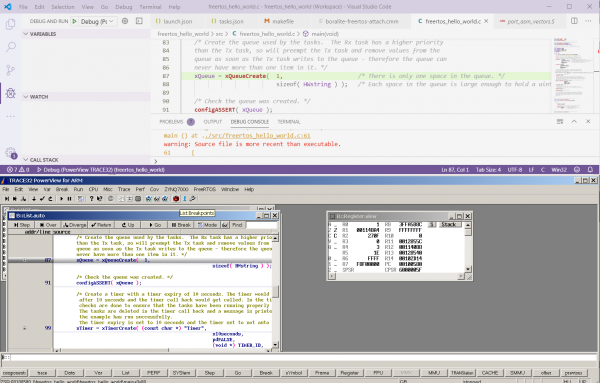
Using VSC as the default editor for PVT32


